Maxima and Minima | Applications
Graph of the Function y = f(x)
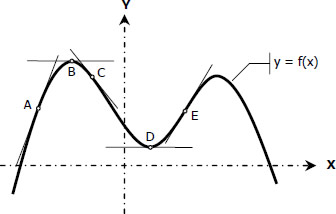
The graph of a function y = f(x) may be plotted using Differential Calculus. Consider the graph shown below.

As x increases, the curve rises if the slope is positive, as of arc AB; it falls if the slope is negative, as of arc BC.
Relative Maximum and Minimum Points
At a point such as B, where the function is algebraically greater than that of any neighboring point, the point is said to have a maximum value, and the point is called a maximum point (relative to adjacent points). Similarly at D, the function has a minimum value (relative to adjacent points). At maximum or minimum points, the tangent is horizontal or the slope is zero.
This does not necessarily mean that at these points the function is maximum or minimum. It does only mean that the tangent is parallel to the x-axis, or the curve is either concave up or concave down. The points at which dy/dx = 0 are called critical points, and the corresponding values of x are critical values.
The second derivative of a function is the rate of change of the first derivative or the rate of change of the slope. It follows that as x increases and y" is positive, y' is increasing and the tangent turns in a counterclockwise direction and the curve is concave upward. When y" is negative, y' decreases and the tangent turns in the clockwise direction and the curve is concave downward.
If y' = 0 and y" is negative (i.e. y" < 0), the point is a maximum point (concave downward).
If y' = 0 and y" is positive (i.e. y" > 0), the point is a minimum point (concave upward).
Points of Inflection
A point of inflection is a point at which the curve changes from concave upward to concave downward or vice versa (see point E from the figure). At these points the tangent changes its rotation from clockwise to counterclockwise or vice versa.
At points of inflection, the second derivative of y is zero (y" = 0).
