Maxima and Minima | Applications
Graph of the Function y = f(x)
The graph of a function y = f(x) may be plotted using Differential Calculus. Consider the graph shown below.
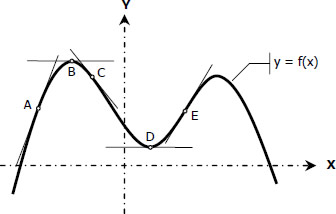
As x increases, the curve rises if the slope is positive, as of arc AB; it falls if the slope is negative, as of arc BC.
- Read more about Maxima and Minima | Applications
- Log in or register to post comments