Consistency of Soil (Atterberg Limits)
Consistency is the term used to describe the ability of the soil to resist rupture and deformation. It is commonly describe as soft, stiff or firm, and hard.
Water content greatly affects the engineering behavior of fine-grained soils. In the order of increasing moisture content, a dry soil will exist into four distinct states: from solid state, to semisolid state, to plastic state, and to liquid state. The water contents at the boundary of these states are known as Atterberg limits. Between the solid and semisolid states is shrinkage limit, between semisolid and plastic states is plastic limit, and between plastic and liquid states is liquid limit.
Atterberg limits, then, are water contents at critical stages of soil behavior. They, together with natural water content, are essential descriptions of fine-grained soils.
Liquid Limit, LL
Liquid limit is the water content of soil in which soil grains are separated by water just enough for the soil mass to loss shear strength. A little higher than this water content will tend the soil to flow like viscous fluid while a little lower will cause the soil to behave as plastic.
Plastic Limit, PL
Plastic limit is the water content in which the soil will pass from plastic state to semi-solid state. Soil can no longer behave as plastic; any change in shape will cause the soil to show visible cracks.
Shrinkage Limit, SL
Shrinkage limit is the water content in which the soil no longer changes in volume regardless of further drying. It is the lowest water content possible for the soil to be completely saturated. Any lower than the shrinkage limit will cause the water to be partially saturated. This is the point in which soil will pass from semi-solid to solid state.
Determination of Liquid, Plastic, and Shrinkage Limits
Casagrande Cup Method for Liquid Limit Test
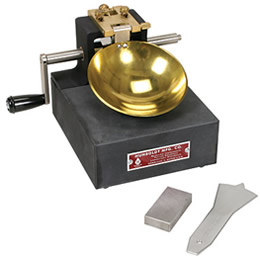
Casagrande Cup
Courtesy of MOHAN LAL AND SONS
The semispherical brass cup is repeatedly dropped into a hard rubber base from a height of 10 mm by a cam-operated crank.
The dry powder of the soil is mixed with distilled water turning it into a paste. The soil paste is then placed into the cup to a thickness of about 12.5 mm and a groove is then cut at the center of the paste using the standard grooving tool. The crank operating the cam is turned at the rate of 2 revolutions per second lifting the cup and dropped it from a height of 10 mm. The liquid limit is the moisture content required to close a distance of 12.5 mm along the bottom of the groove after 25 blows.
The required closure in 25 blows is difficult to achieve in a single test. Four or more tests to the same soil at varying water contents are to be done for 12.5 mm closure of the groove. The results are then plotted on a semi-logarithmic graph with moisture content along the vertical axis (algebraic scale) and number of blows along the horizontal axis (logarithmic scale).
The graph is approximated by the best fit straight line, usually called the flow line and sometimes called liquid state line. The moisture content that corresponds to 25 blows is the liquid limit of the soil.
The slope of the flow line is called flow index and may be written as
where w1 and w2 are the water content corresponding to number of blows N1 and N2, respectively.
Plastic Limit Test
The plastic limit can easily be found by rolling a small soil sample into thin threads until it crumbles. The water content at which the threads break at approximately 3 mm in diameter is the plastic limit. Two or more tests are made and the average water content is taken as plastic limit. In this test, soil will break at smaller diameter when wet and breaks in larger diameter when dry.
Fall Cone Method for Liquid and Plastic Limit Tests
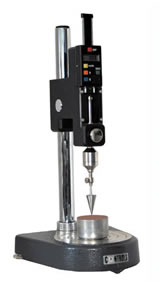
Cone Penetrometer
Courtesy of SAIGON ISC
Fall cone method offers more accurate result of liquid limit and plastic limit tests. In this method, a cone with a mass of 80 grams and an apex angle of 30° is suspended above so that its pointed part will just in contact with the soil sample. The cone is permitted to fall freely under its own weight for a period of 5 seconds. The water content that allows the cone to penetrate for 20 mm during this period defines the liquid limit of the soil.
Like the cup method, four or more tests are required because it is difficult to find the liquid limit in a single test. The results are then plotted into a semi-logarithmic paper with water content along the vertical axis (arithmetic scale) and penetration along the horizontal axis (logarithmic scale). The best fit straight line is then drawn and the water content that corresponds to 20 mm penetration defines the liquid limit.
The plastic limit can be found by repeating the test with a cone of similar geometry but with a mass of M2 = 240 grams. The liquid state line of this cone will be below the liquid state line of the M1 = 80 grams cone and parallel to it.
The plastic limit is given as
Back to top
Shrinkage Limit Test
The shrinkage limit is determined as follows. A mass of wet soil, m1, is placed in a porcelain dish 44.5 mm in diameter and 12.5 mm high and then oven dried. With oven-dried soil still in the dish, the volume of shrinkage can be determined by filling the dish with mercury. The volume of mercury that fills the dish is equal to the shrinkage volume. The shrinkage limit is calculated from
where m1 = mass of wet soil, m2 = mass of oven-dried soil, V1 = volume of wet soil, V2 = volume of oven-dried soil, and ρw = density of water.
Other Formulas
Shrinkage ratio
Specific gravity of solids