From Calculus to Code: A Circle Rolling on a Parabola
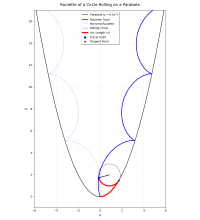
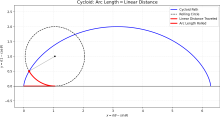
In this post, we extend the idea of cycloidal curves to a more complex path: the parabola. Using the tangent angle, arc length, and no-slip condition, we derive the parametric description of the tracing point and show how these formulas can be translated into Python code for accurate Manim visualization.
- Read more about From Calculus to Code: A Circle Rolling on a Parabola
- Log in or register to post comments


Recent comments
is it not…